Butterworth approximation of filter response is one of the popular choice in filter design. It has flat response in the passband and the roll-off increases with increase in the order of the filter. That is higher the filter order faster will be the roll-off the the filter. Here 3rd order Butterworth low pass filter is build on breadboard and tested. The filter topology used is Sallen-Key. The frequency response of the filter is also shown.
Recommended Prerequisites
– Active 2nd order LPF on breadboard
– Active 1st Order Low Pass Filter Design on Breadboard
– First order Active HPF Design and Test
Circuit design specification
The Butterworth low pass filter designed here has the following specification.
- Cutoff frequency is 1KHz
- Passband attenuation is 0.1dB
- Order is 3
- Sallen-Key Topology
- Unity Gain filter
The
following video shows how the 3rd order Butterworth filter works. It
shows how the magnitude of the filtered output waveform decreases as the
frequency is increased. This illustrates how the filter filters out the
high frequency signal. The video also shows what happens when multiple
tone signal with different frequencies is sent though the filter. The
signal with frequency lower than 1KHz is retained and higher frequencies
are filtered out.
Breadboard & Circuit Schematic
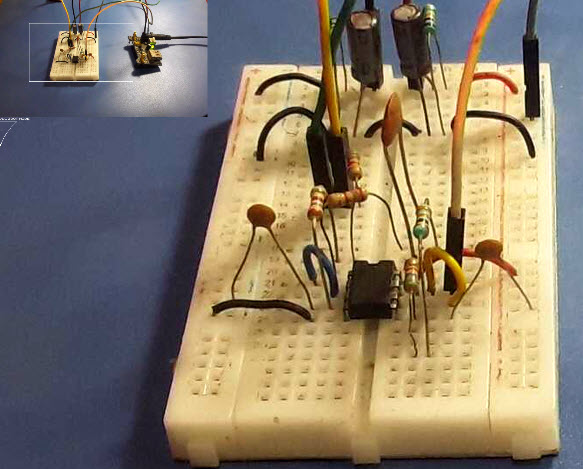
Following picture shows the 3rd order Butterworth filter assembled on breadboard. The filter is designed with LM358 op-amp. A third order filter with op-amp requires two op-amp and LM358 op-amp is a dual op-amp and thus has two op-amp build into it’s integrated circuit(IC) chip. Other dual op-amp can also be used such as TL072 op-amp.
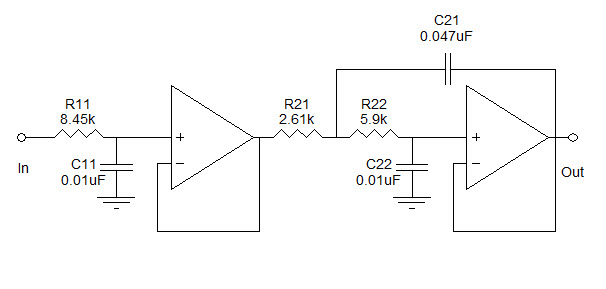
The corresponding circuit schematic of the above bread boarded filter is shown below.
The above circuit has 3 RC filters composed of R11, C11 as the first, R22, C22 as the second and R21, C21 is the third. The two op-amp represents the two-amp in the LM358.
Waveform and Frequency Response
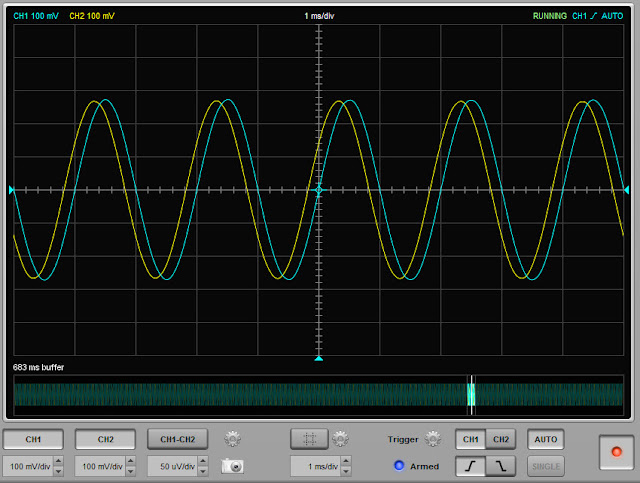
The following graph shows the input and filtered output signals waveform when the input signal frequency is 500Hz. As can be seen this output signal waveform amplitude is same as the input signal waveform amplitude. This is because the filter is unity gain filter and the frequency is below the 1KHz cutoff frequency of the filter.
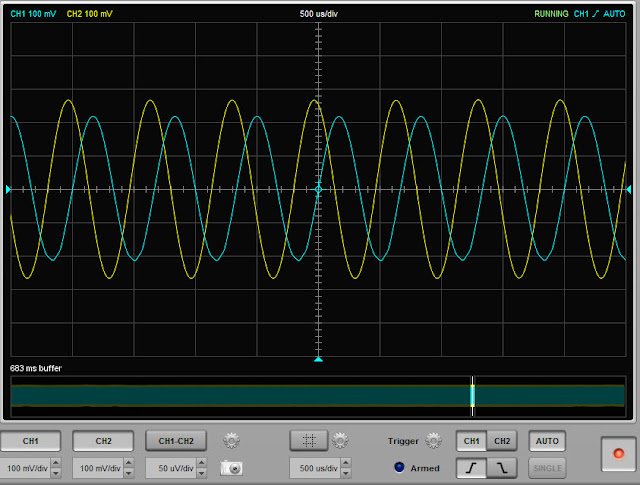
The following graph shows the input and filtered output signals waveform when the input signal frequency is 1.5KHz. As can be seen the output signal waveform amplitude is now lower than the input signal waveform amplitude. This is because of the filtering action of the filter which has cutoff frequency of 1KHz.
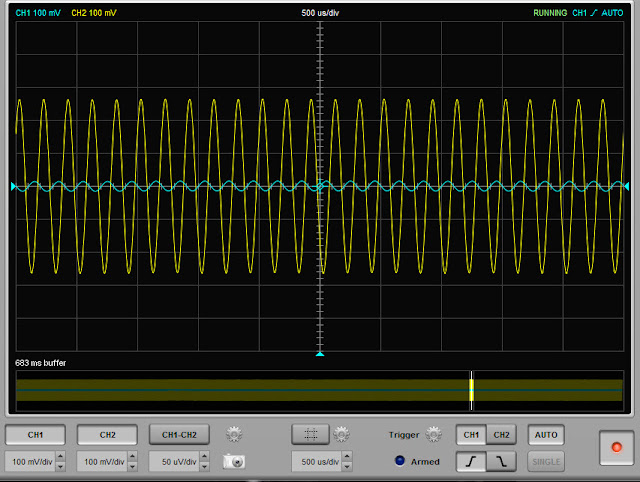
The next graph shows the input and filtered output signals waveform when the input signal frequency 5KHz. This illustrates that the input signal is filtered heavily at 5KHz.
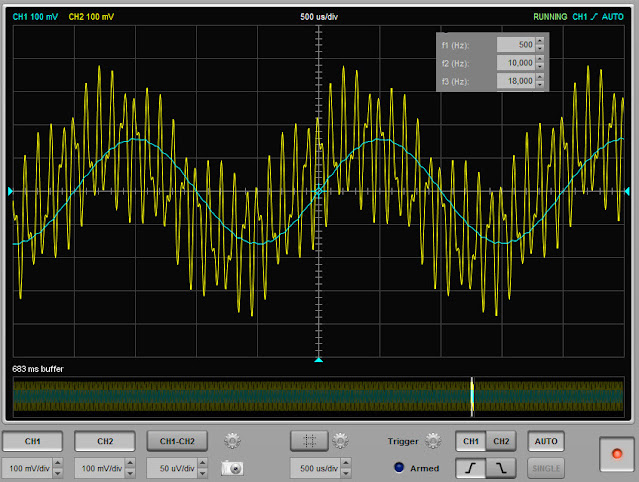
The next waveform graph illustrates the filtering action of the filter when multi-tone signal with frequencies of 500Hz, 10KHz and 18Khz is sent through the filter. As can be seen the output from the filter has signal at 500Hz because it is below the cutoff frequency of the filter.
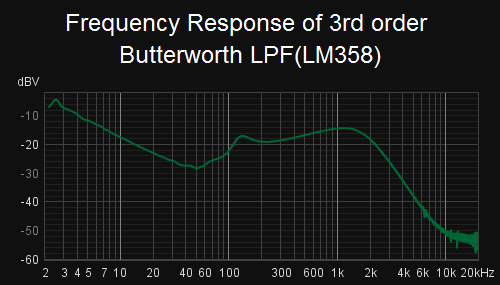
The frequency response of the designed Butterworth low pass filter.
Filter Calculators
For filter design see the following online filter calculators.
– 2nd Order Active LPF Calculator Online
– First Order Active Low Pass Filter Calculator Online
– Second Order LC Low Pass Filter Calculator
