
Here we demonstrate how we can use Matlab Simulink as real time oscilloscope. With the matlab simulink oscilloscope demonstrated here actual signal can be viewed and analyzed in time and frequency domain in real time. This is useful to electronics hobbyist or engineering or physics students. It is also useful to professional as matlab simulink has many build in functions and features which can be used alongside the actual signal.
Update: The tutorial How to design a Practical LM358 Op-Amp Inverting Amplifier uses simulink PC oscilloscope and function generator to test designed amplifier in real time.
The matlab oscilloscope is made using the audio device reader, the Time Scope and Spectrum Analyzer
available in the simulink. The audio device reader is available in the
audio toolbox and the time scope and spectrum analyzer is available in
the DSP toolbox. The audio device reader block is used to acquire signal
in real time from the PC audio input line in or microphone port. This
signal is sent to the time scope and spectrum analyzer.
Watch the video demonstration:
Basic Setup
The following picture shows the basic Simulink block diagram configuration for Oscilloscope.

In
the above model, the audio device reader block reads in left and right
channel signal simultaneously and outputs stereo signal. The
configuration of the audio device reader is shown below. Notice that the
Number of channels is specified as 1.

The time scope block
is used to view the waveform of the acquired signal in time domain. It
has many useful features which are available in actual oscilloscope.
These features are listed below
Trigger
Cursor Measurements
Signal Statistics
Bilevel Measurements
Peak Finder
The
spectrum analyzer block is used to analyze the acquired signal in frequency domain. It also has useful features which are listed below.
Cursors — Measure signal values using vertical and horizontal cursors.
Peak Finder — Find maxima, showing the x-axis values at which they occur.
Channel Measurements — Measure the occupied bandwidth or adjacent channel power ratio (ACPR).
Distortion Measurements — Measure harmonic distortion and intermodulation distortion.
CCDF
Measurements — Measure the complimentary cumulative distribution
function. CCDF measurements show the probability of a signal’s
instantaneous power being a specified level above the signal’s average
power.Spectral Masks — Visualize spectrum limits and compare spectrum values to specification values.
With
these excellent features of time scope and spectrum analyzer blocks we
get a very good signal analysis tool such as provided by real high end
oscilloscopes.
Now we can connect signal source to the PC audio
input port(Line In/Microphone). The signal source can be from the
circuit on a breadboard or from waveform generators(function
generators). We have illustrated how we can connect external signal for
analysis into the PC audio port in the previous tutorials:
– Testing of self biased BJT amplifier on breadboard with PC oscilloscope
– How to build base biased BJT amplifier on breadboard and test with PC soundcard based oscilloscope
In
this demonstration we will use soundcard scope software to generate
signal from the PC speaker. The output of the PC speaker should be
connected to the PC Line In/Microphone input using a male to male 3.5mm
audio jack as shown in the picture below.

Now
the soundcard scope software(or any other waveform generator software
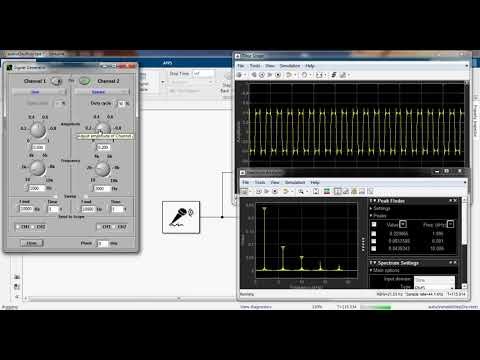
like audacity) should be configured to send signal. Following picture
shows how to generate sine wave from channel 1(left channel) and square
wave from channel 2(right channel) using soundcard scope software.

As
you can see we can set the amplitude and frequency of the signal at
both left and right channel. Also we can use the dropdown menu to select
various types of signals such as sawtooth, sine, square and triangle
or create a custom signal.
The signal from signal generator goes out
from the PC speaker and enters back into audio device reader from the PC
Line In/Mic port. We can then run simulation(set to inf) in simulink
and observe the signal waveform in time domain and the frequency spectra
in the spectrum analyzer.
The following shows the signal waveform in the time scope,

As
you can see the yellow signal is the sine wave and the blue is the
square wave we had generated earlier from the soundcard scope software.
The spectrum analyzer display is shown below,

On the right side we can see the frequencies of the signal generated from the left and right channel.
This is how we can use matlab simulink as an oscilloscope to view signal in real time.
Two channel Setup
We
can also separate the left and right channel signal from the main
stereo signal coming out of the audio device reader block. This
essentially gives us two channel oscilloscope. That is we can use two
probes to acquire signal from a circuit.
If we want to
separate left and right channel signal fro the audio device reader first
we have to configure the audio device reader for two channels as shown
below.

Then we need to split the matrix output from the audio device reader into two separate vectors. This is done using the selector block. The following picture shows how to obtain left and right channel signal from the output of audio reader device.
 How
Howto split matrix signal in simulink? The output from the audio device
reader is a 1024×2 matrix which has to be split first to get the two
channel data. The two selector blocks which are shown above are
configured as shown below to get the two matrix vectors for the left and
right channels.

Once
we have setup the block diagram in simulink for two channel
oscilloscope as shown above we can use the soundcard scope again to
generate two different signals in each channel and view their signals
separately.
The process of generating signal two different signals in
left and right channel from soundcard scope software was explained
above. We can setup the time scope to display two graphs for each signal
by configuring the layout in the time scope block configuration box.
When we run the simulation we can view the signals in the time scope separately as shown below.

The
upper signal sine waveform corresponds to left channel and the lower
square signal waveform corresponds to the right channel.
Unlike in time scope we get the frequency spectra of both channel on the same window as shown below.

In
this way we can use Matlab Simulink as an Oscilloscope to view real
signal waveform and frequency spectrum. The only drawback here is that
we can only analyze signal with frequencies upto 22KHz. This is because
we are using PC sound card and the audio device reader is using that
sound card. For RF application and other high frequency analysis this
will not work. But for most application and experimentation it is
adequate.
If you are interested in real time graph of signals see the following alternatives:
– How to plot real time data from arduino in matlab
– Real-Time Serial Graph with P5.js


